Formatting Data Correctly for Statistical Analysis

22 Oct 2019
How many times have you extracted data from some system or application, and you've been given this wonderful excel file containing a beautifully populated matrix of data, only to find you can't analyse it with your statistics package?

It happens more frequently than you might imagine.
Formatting Data Correctly in a Worksheet for Statistical Analysis

One shift that needs to take place for you if you’re a user of MS Excel and learning how to use statistical analysis software such as SigmaXL, is the way you think about how data is laid out on a worksheet. This article is to help you make that shift.

I’ll explain this with a simple example.

Suppose you were collecting data about the work performed by different machines over each day of a month … plus you wanted to separate the data by day and night shift. This data might be extracted from whatever source you have and put into an excel worksheet like this.

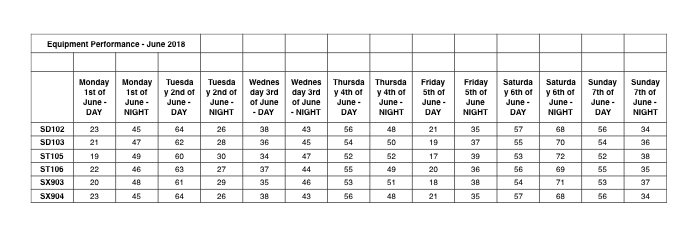
What you have is data laid out in a matrix form where the actual values you want to study form the various axis of this matrix.

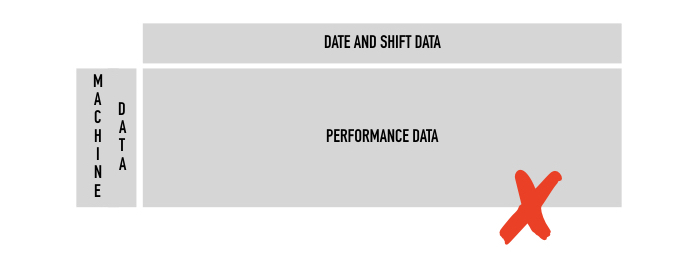
The problem with this is the difficulty in using an analysis tool like SigmaXL. The layout is all .. well .. screwed up.

What we need is data that is in the form of what we refer to as ‘stacked’. Stacked data is laid out in the form where the data for each variable in the study is inserted directly underneath a heading. It would look like this.

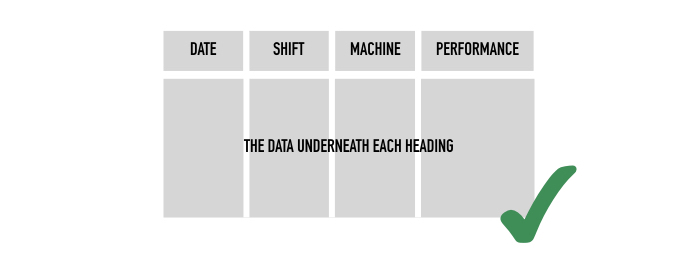
Stacked data like this can be studied easily using the various statistical analysis functions of packages such as SigmaXL and Minitab.

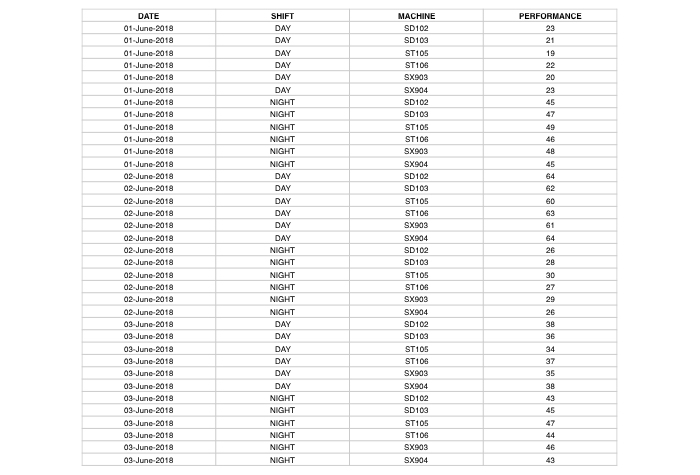
So what would our bad example look like if we arranged that same data into a good layout for analysis.

What we would do is list all of the variables in this data set as headings across the top of the sheet, and then the actual data within each of these headings would be contained in the cells below the headings in such a way that all related data is alongside each other across rows.

It would look like this … note this is exactly the same data as shown in the bad example up top of this article.

That’s it, nice and simple.

Author: George Lee Sye
George is one of the most sought after lean six sigma trainers in the country. For more information about his work, visit 9 Skills Factory
Loading...
ARE YOUR LEADERSHIP SKILLS SUFFICIENT ..
FOR THE MOST COMPETITIVE ENVIRONMENT YOU'VE EVER EXPERIENCED?
ADVANCING CAREER AND BUSINESS SUCCESS

Professional Development

Courses built on a foundation of 50 years of working and 25 years in business as a change leader,  influencer and content creator.

Follow Us on Social Media

© 2019-2025 by George Lee Sye (Soarent Publishing ABN: 89699416331) - All Rights Reserved; no part of this publication and the publications provided in this product may be reproduced, stored in a retrieval system, or transmitted in any form or by any means, electronic, mechanical, photocopying, recording, or otherwise [except as required for the use of the purchaser of this product to complete the training course for which this is an accompaniment] without either the prior written permission of the copyright owner or a license permitting restricted copying issued by the copyright owner. This publication and the publications provided in this product may not be lent, resold, hired out or otherwise disposed of by way of trade in any form of binding or cover other than that in which it is published, without the prior consent of the copyright owner.

We use cookies to give you the best possible experience on our website. By continuing to browse this site, you give consent for cookies to be used. For more details please read our Cookie Policy